About
This article will describe how to debug the STM32F4 microcontroller using the zylin eclipse plugin. The following setup will be used:
- STM32F4 discovery board
- The built-in SWD programmer/debugger on the discovery board
- Toolchain and example program from this tutorial (I have updated the build script for debugging to work, so if you have followed the tutorial before you may have to download and run the summon-arm script again)
The result will look something like this:
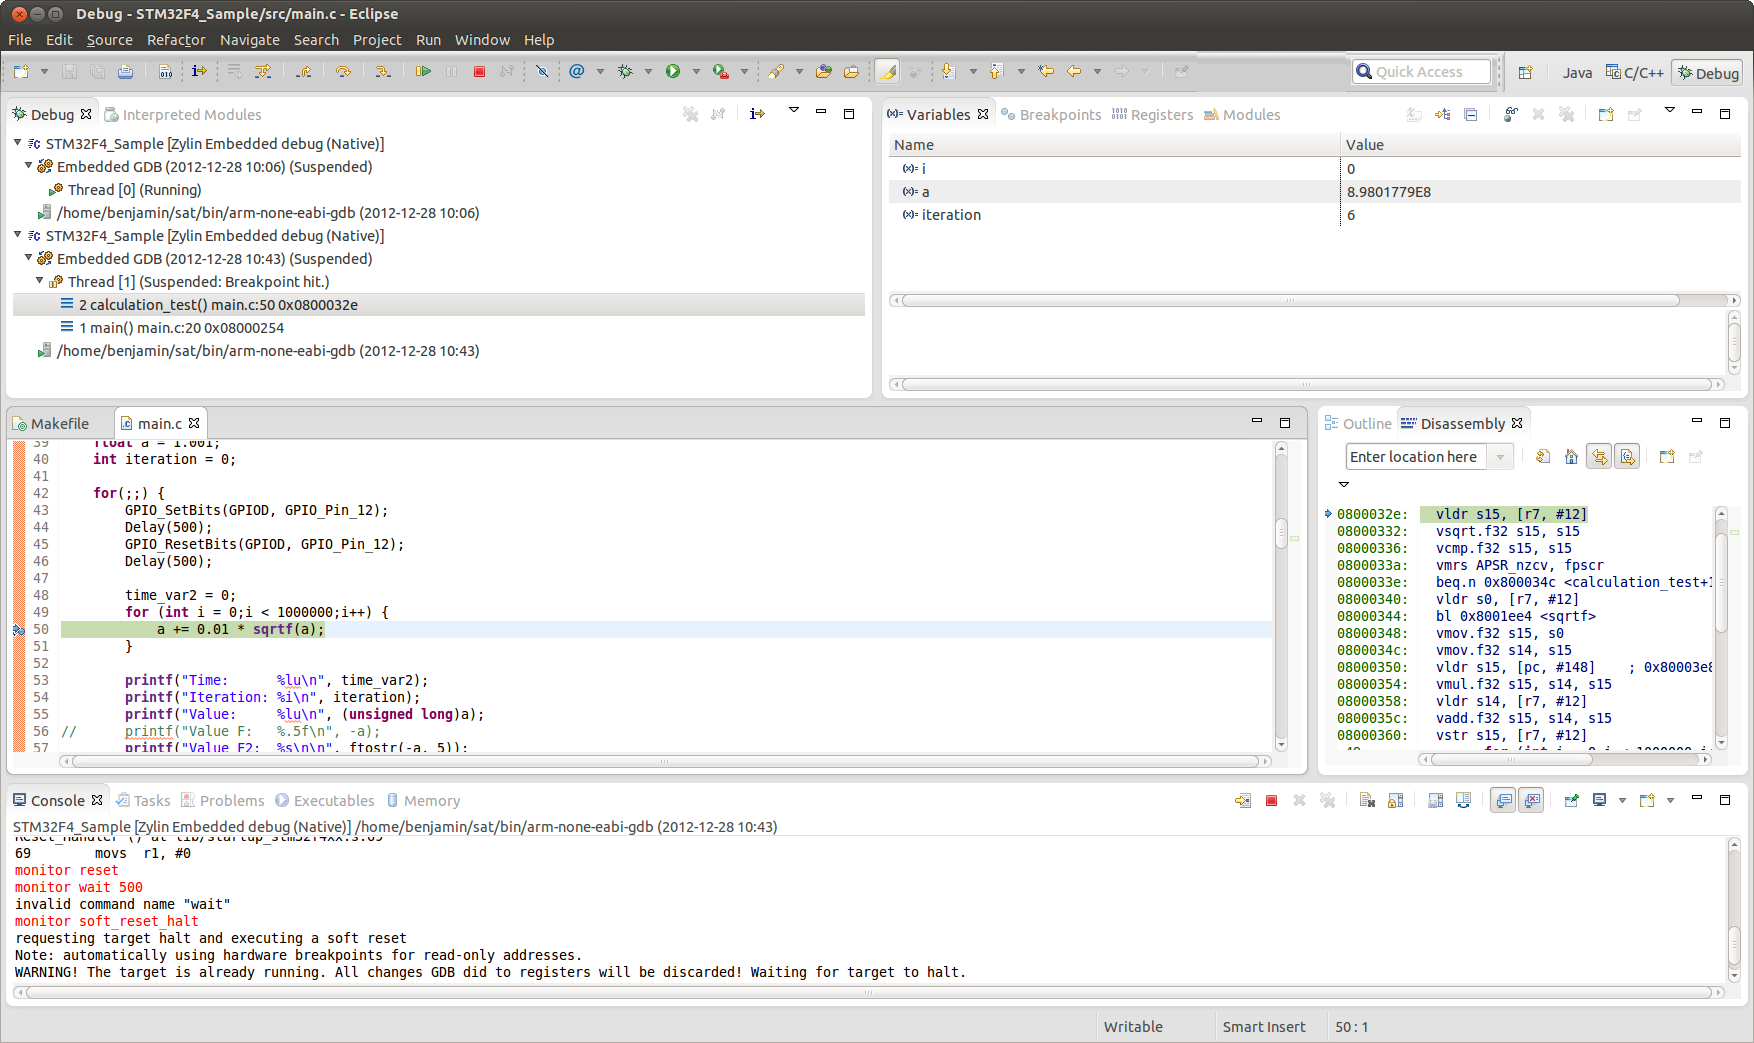
You can:
- Set hardware breakpoints
- See variable values when hitting the breakpoints
- Change variables, then continue
- Many other things…
Install the toolchain and Eclipse
The required toolchain can be installed by following this tutorial. Also, install eclipse as is described there and import the sample makefile project.
Once Eclipse up and running, go to Help > Install New Software… and add
http://opensource.zylin.com/zylincdt
follow the steps to install it and restart eclipse.
Set up the debug configuration
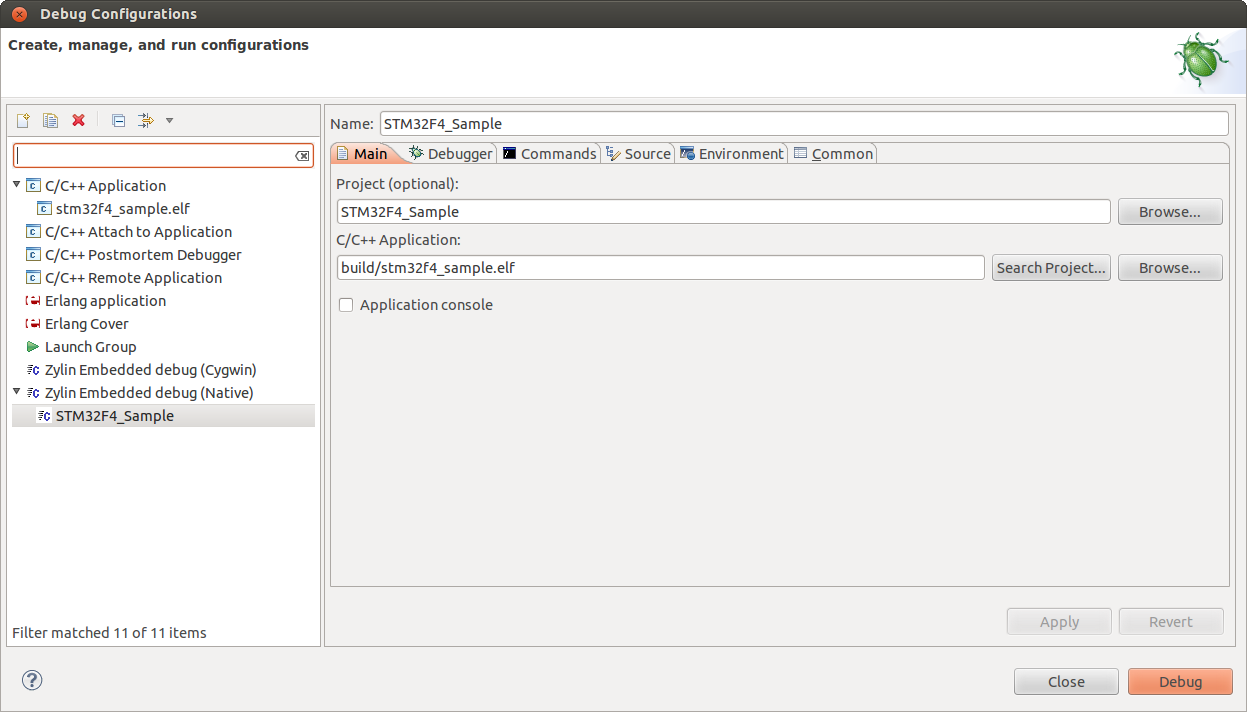
In Eclipse, open Run > Debug Configurations… and create a new launch configuration under Zylin Embedded debug (Native). Set the project name and choose the .elf file for the application. This can look something like this:
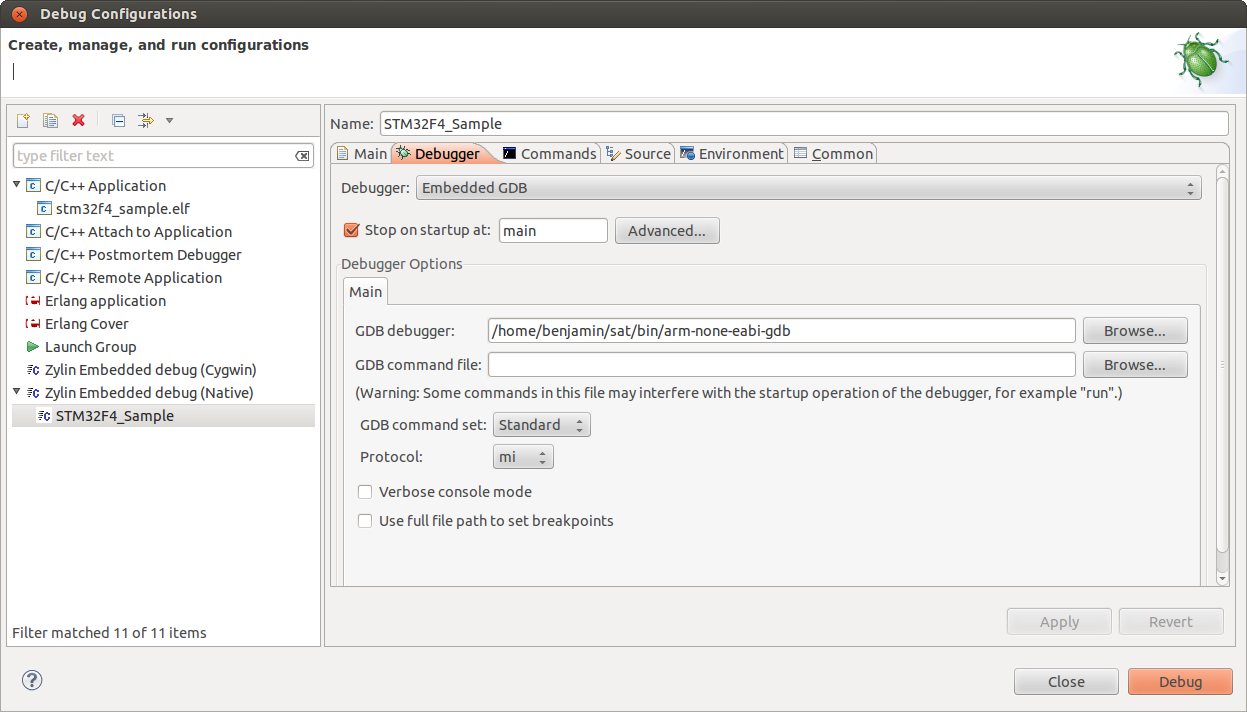
Make sure that the project is built before so you can choose the correct .elf file. Now, go to the Debugger tab and set the correct path to gdb. After running the summon-arm script, it should be
/home/YOUR_USERNAME/sat/bin/arm-none-eabi-gdb
where you replace YOUR_USERNAME with your username. This should look something like the following:
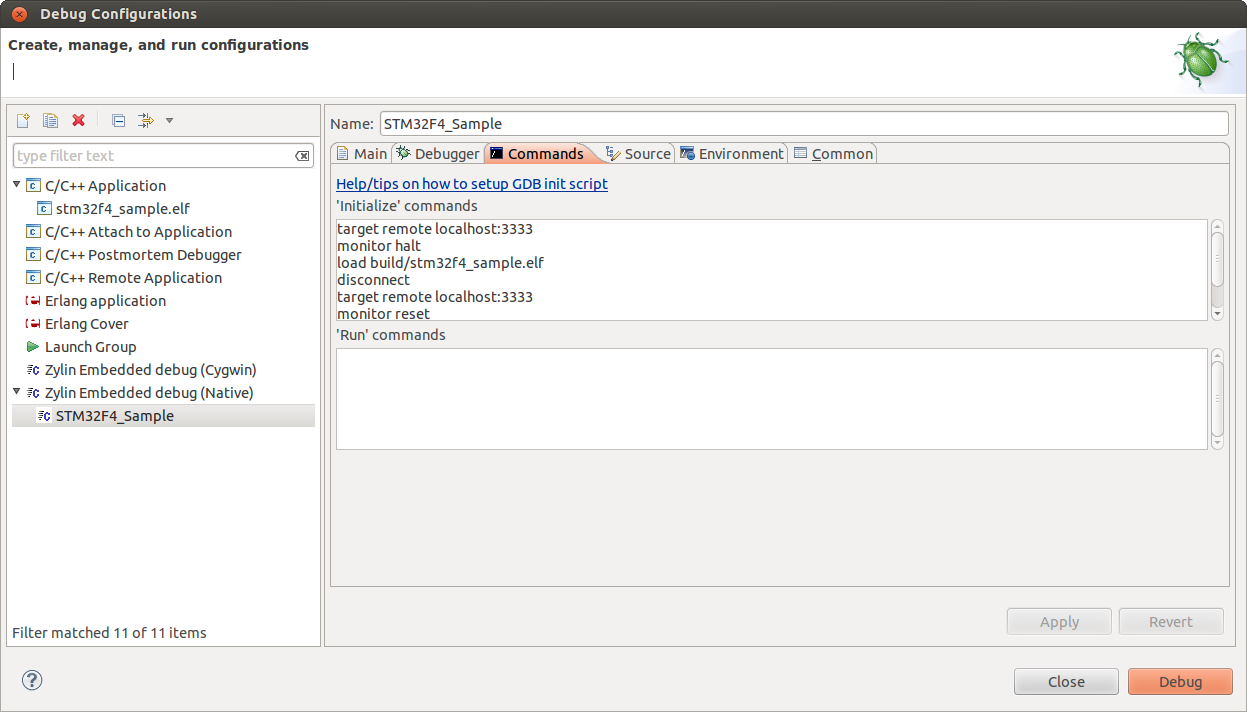
Next, go to the Commands tab and paste in the following ‘Initialize’ commands:
target remote localhost:3333
monitor reset
monitor halt
load
disconnect
target remote localhost:3333
monitor reset
monitor halt
Make sure that you modify the load line with your .elf file. This should end up looking something like this:
Alternatively, if the above commands don’t work, you can try something like this:
target remote localhost:3333
monitor reset
monitor halt
monitor flash protect 0 0 11 off
monitor flash write_image erase "/path/to/hex/file" 0 ihex
disconnect
target remote localhost:3333
monitor reset
monitor halt
You have to change the path to the hex file in the write_image command above.
That’s it for the Eclipse part! You can’t start debugging yet though, you have to start the openocd server first.
Starting the openocd server
Create a file called stm32f4discovery.cfg with the following content:
# This is an STM32F4 discovery board with a single STM32F407VGT6 chip.
# http://www.st.com/internet/evalboard/product/252419.jsp

source [find interface/stlink-v2.cfg]

source [find target/stm32f4x_stlink.cfg]

# use hardware reset, connect under reset
reset_config srst_only srst_nogate
As you can see, it should be fairly easy to modify this file for other MCUs. You can go to ~/sat/share/openocd/scripts/target to find other target files for openocd.
Now, from the same directory, run openocd with the following command:
openocd -f stm32f4discovery.cfg
If everything went well, you should get something like the following output:
Open On-Chip Debugger 0.7.0-dev-snapshot (2012-12-28-09:05)
Licensed under GNU GPL v2
For bug reports, read
	http://openocd.sourceforge.net/doc/doxygen/bugs.html
adapter speed: 1000 kHz
srst_only separate srst_nogate srst_open_drain
Info : clock speed 1000 kHz
Info : stm32f4x.cpu: hardware has 6 breakpoints, 4 watchpoints
Start debugging!
Now that openocd is running, you can launch the debug configuration in Eclipse and open the Debug perspective. Then you should see something like the screenshot in the beginning. Note that when you start debugging, the program will be uploaded to flash of the STM32 as well.
When the debug session is started, you can click on Resume (F8) to start execution. Then the program will run until you click Suspend or until you hit a breakpoint, then you will see the current line you are executing in the source code and the variables and their values in the current scope. Breakpoints can be set/toggled/reset by right-clicking in the leftmost part of the source code editor. If this is done while the program is running, it will halt as soon as the breakpoint is hit.
Troubleshooting
Here are some problems that I encountered while working on this and possible workarounds:
Sometimes it is not possible to start the debug session or it “kind of” starts, but does not seem to work correctly.
This can often be solved by stopping openocd, unplugging and re-plugging the board and then starting openocd again.
Some variables cannot be seen or changed and the assembler code does not seem to match the c-code perfectly.
This is most likely because the code is compiled with optimizations enabled. If you are using my example project, you can open the makefile and change this line:
CFLAGS = -std=gnu99 -g -O2 -Wall -Tstm32_flash.ld
to
CFLAGS = -std=gnu99 -g -O0 -Wall -Tstm32_flash.ld
Only the disassembly is shown when pausing the program or when hitting breakpoints, but not the c source file.
This can happen when the program is compiled without the -g option. This option will tell the compiler to generate:
- symbol names
- type information for the symbols
- file and line numbers where the symbols came from
This information is then used to display the line numbers and variables in the source file.
Hi there, great tutorials you’ve got here, thanks :).
I got a STM32F4Discovery and went through your Get started article yesterday and was able to compile using Eclipse.
But now I am getting an ‘Can’t find interface/stlink-v2.cfg’ in procedure ‘script’ error when trying to start the server with openocd -f stm32f4discovery.cfg … any ideas
Hi, Did you use the right version of the summon-arm script? I modified it a bit and added a patch while writing this tutorial, so if you have downloaded it before I uploaded this tutorial it will not work. For reference, this is the right version:
https://github.com/vedderb/summon-arm-toolchain
I used the zip file from provided in the Get started article. I got your version from github now, but the script is stopping at :”Patching binutils to allow SVC support on cortex-m3″. The last output is Patch: *** Onlygarbage was found in the patch input.
did you download the patch directory as well? Only the script itself does not work as it assumes that the patches are present a certain relative location.
I ran it right now on my desktop, and it works fins for me.
I found out that you can also use Texane stlink (https://github.com/texane/stlink) to open the connection. It works default on port 4242, but openocd works better however.
Also, you can debug microcontrollers from other manufacturers than ST. If you can download a program using stlink-V2 and openocd, you can debug the microcontroller. I have succesfully debugged my LPC1313 (using a custom cfg-script since it’s not natively supported by openocd).
Ok, after realizing i had a broken cable everything went fine so far…
I set up the debug configuration in eclipse and started the openocd server. When i now try to run my debug configuration eclipse says ‘target request failed’ and the following console message appears:
source .gdbinit
target remote localhost:3333
warning: Can not parse XML memory map; XML support was disabled at compile time
0x00000000 in ?? ()
monitor halt
target was in unknown state when halt was requested
target state: halted
target halted due to debug-request, current mode: Thread
xPSR: 0x21000000 pc: 0x08000230 msp: 0x2001ffd8
load build/stm32f4_sample.elf
Loading section .isr_vector, size 0x188 lma 0x8000000
Loading section .text, size 0xb2dc lma 0x8000188
Loading section .data, size 0x8e8 lma 0x800b464
Start address 0x800ada5, load size 48460
Remote connection closed
disconnect
You can’t do that when your target is `exec’
target remote localhost:3333
Reset_Handler () at lib/startup_stm32f4xx.s:69
69 movs r1, #0
monitor reset
monitor wait 500
invalid command name “wait”
monitor soft_reset_halt
requesting target halt and executing a soft reset
Well, the console message looks very similar to what I get (and I realized the wait command isn’t working, so I removed it). Do you get the error as soon as you start debugging or are you doing something first? After I start the debug session (and get the same console output as you) I can click Resume in eclipse to start the program (the LEDs in the discovery board indicate that it is running). When I click in pause I see the source line the cpu is executing and the variables in that scope. Resuming, pausing, setting break points etc should work from this point without problems. However, sometimes the debug session does not start properly, so then I have to unplug and replug the discovery board and restart the openocd server.
Hey, yes I,m getting the Error: “Target request failed: Warning:\Cannot insert breakpoint 1. Error accessing memory address 0x800ad98: Unkown error -1.” as soon as i press the Debug button.
Here is the OpenOCD log:
Info : accepting ‘gdb’ connection from 3333
Info : device id = 0x10016413
Info : flash size = 1024kbytes
Warn : acknowledgment received, but no packet pending
undefined debug reason 6 – target needs reset
Warn : target was in unknown state when halt was requested
target state: halted
target halted due to debug-request, current mode: Thread
xPSR: 0x21000000 pc: 0x08000234 msp: 0x2001ffd8
Error: gdb requested a non-existing register
Info : dropped ‘gdb’ connection
Info : accepting ‘gdb’ connection from 3333
Warn : acknowledgment received, but no packet pending
requesting target halt and executing a soft reset
maybe somehow gdb is not able to halt the running boards application?
Try to change the last line in command from
monitor soft_reset_halt
to
monitor halt
and see if it helps.
Hey again,
that seemed to do the trick for most of the time!
Thanks for your help 🙂
Your tutorials are just amazing: clear and complete. Thank you for this valuable resource.
Hi there, great tutorial.
But I have one small problem.
If I modify the program and start a new debug sesion, the program acts like the previous one. OpenOpcd seems to write the new program succesfuly. (I tried with bouth variants of the scripts and using -g, -O0 when compiling).
I have made another test, if I writh the .bin file using qtstlink, debuger works again perfectly. It is like elf file is not written corectly.
Here is a simple(r) way to debug with GDB/OpenOCD and Eclipse:
1. Install the GDB Hardware Debugging plugin. Search for it in the “Help -> Install New Software” window.
2. Create a new GDB Hardware Debugging configuration. Set the gdb command, for example arm-none-eabi-gdb, and select “OpenOCD (via pipe)” as JTAG device. In the openocd connect string field, put something like this:
| openocd -f board/stm32ldiscovery.cfg -c “gdb_port pipe; log_output openocd.log; init; reset init”
That is it! The rest can be default. Just click “Debug” and enjoy.
Thanks for the tutorial, I have an issue that I’m unable to do any useful debugging due to no symbols being loaded.
I modified the makefile to include the -g option, however when I debug in eclipse, I get
Thread[1] (suspended)
1 0xfffffff8
etc.
Any help?
Which version of openocd are you using? In my summon-arm script I had to patch openocd for debugging to work at all on the stm32f4 and stlink.
For me, it only works about every second time I start the debugger, and I guess this is because the stlink-support is a bit limited in openocd.
I have updated the summon-arm script on my github page with gcc 4.8 and the very latest versions of the other tools as well, so you could give that a try too. I haven’t tested it yet with debugging though.
Thank you for very clear and helpful tutoriuls. I have a weired problem. When I start debug I get a kernel panic. I can share more info it I know what is relevant. I have the same bourd as above with usb on ubuntu 13.04 and I have debugged with the same tutorial another arm bourd but cortex-m3.
Hi,
I don’t know if it is a good idea to use USB on the MCU and pause the execution – this will block USB interrupts and could go against the USB specification. I think that a kernel panic is a bit heavy reaction though, I haven’t experienced that myself.
Thank you for your blog,but I met some problem when start Debug,can you help me?The problem is like this:
target remote localhost:3333
Remote debugging using localhost:3333
0x080002cc in ?? ()
monitor reset
monitor halt
target state: halted
target halted due to debug-request, current mode: Thread
xPSR: 0x81000000 pc: 0x080002d0 msp: 0x2000ffc8
load /home/lrfy/workspace/stm32f4_cam/Debug/stm32f4_cam.hex
Loading section .sec1, size 0x101c lma 0x8000000
Start address 0x8000fa8, load size 4124
Transfer rate: 7 KB/sec, 4124 bytes/write.
disconnect
Ending remote debugging.
target remote localhost:3333
Remote debugging using localhost:3333
0x08000fa8 in ?? ()
monitor reset
monitor halt
target state: halted
target halted due to debug-request, current mode: Thread
xPSR: 0x81000000 pc: 0x080002d0 msp: 0x2000ffc8
why it went out”0x08000fa8 in ?? ()”? I’ll be grateful if you can help me!
Oh,I find the reason. I should add Debug/stm32f4_lcd.elf in the Debug Configuration~
Hi Benjamin,
thanks for your tutorial! I got a simple example program to work, but when I try to debug a more complex program, GDB is quit before reaching the debugging phase. The program code loaded on the device is working though (after another hard reset). Here is the output of the GDB (verbose): https://www.dropbox.com/s/dadyw3wj7l23za7/gdb.txt
Do you have any idea why this fails?
Hi Sven,
I haven’t seen your code, but one similar issue I had is that the SWD interface stops when the MCU is put into sleep mode. It will also stop working if you put the SWD pins into some other mode e.g. GPIO. So, make sure that sleep (WFI) instruction isn’t used and that you don’t reconfigure the SWD pins.
I have found the reason for my problems: Virtual folders. If I remove all virtual folders from my project, the debugging works.
Pingback: Get started with the STM32F4 on Ubuntu Linux | Benjamin's robotics
Pingback: STM32F4 – In-circuit Debugging | Iztok's HW/SW Sandbox
Pingback: How to do JTAG debugging using OpenOCD and Olimex ARM-USB-TINY-H on M24SR-Discovery | Life in Linux Kernel
Pingback: VESC – Open Source ESC | Benjamin's robotics
Pingback: STM32F4 openOCDコンソールを使ってデバッグする方法 | なんでも書いちゃうブログ
Pingback: STM32F4 openOCDコンソールを使ってデバッグする方法 | なんでも書いちゃうブログ
please help me out i am getting error after make upload of bootloader, that adapter speed doesnt match. .. and in GUI window its showing no firmware, but i follwed your instruction same as your vedio..
pleas help me out to solve this, i will be glad to see your reply
Hi Benjamin,
I’m trying to use this debugging tutorial with the VESC. I’m currently using a ST-LINK/V2 programmer by ST. Everything went fine, but I got one problem : I cannot see the printf output in the Eclipse terminal. I bought my VESC on Enertion website so I don’t know if all the necessary hardware is already on that board in order to do some debugging.
I’d be glad with any answer from you 🙂
Thanks in advance !
Very helpful article. I was in a problem with stlinkv2. Your qstlink works very well. Thank you.